divgraph.js
| 
|
Even if you are not an expert JavaScript programmer, you can use divgraph.js
to added professional-looking graphics to your page.
In fact, all of the code for all of the examples shown here
can be displayed and simply clipped right into a page you are working on.
An extensive set of examples is provided. A complete list of parameters is also available.
See function.htm for additional programming information.
Getting Started
The following three lines are all that are needed at the top of your page
to make plotting available. Then just put divgraph.js and its associated GIF files
(which are used for plotting points, drawing tics, and creating curves)
into the directory your web page is in.
<head>
<script language=javascript src=divgraph.js></script>
</head>
Alternatively, if you want to keep divgraph.js in a separate subdirectory
(so that several web pages can all access the same package),
then you must indicate the directory containing the GIF image
files to be used, for example:
<head>
<script language=javascript src=../divgraph/divgraph.js></script>
<script language=javascript>GR.imagedir="../divgraph"</script>
</head>
The very simplest graphing program is shown below and is
given also as Example i1.
<head>
<script language=javascript src=divgraph.js></script>
</head>
<script language=javascript src=divgraph.js>
 GRopengraphwindow()
 GRdrawgraph()
 GRclosegraphdocument()
</script>
Let's see what these statements do:
GRopengraphwindow()
|
The first of these statements opens a new graphing window and its associated document for writing.
If a frame were to be used instead, then the command would be the following: GRopengraphframe(framename)
|
GRdrawgraph()
|
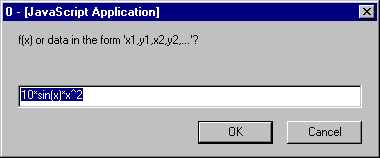
This draws the graph. Since no information is given, the user
will be prompted in this case for what to graph.

|
GRclosegraphdocument()
|
This statement closes the graph window document so that the graph can be printed.
|
x
y

copyright 2001 Robert M. Hanson. All rights reserved. divgraph.js is freely distributable for noncomercial purposes, provided reference is made as "divgraph.js was developed at St. Olaf College by Robert M. Hanson (http://www.stolaf.edu/people/hansonr/divgraph)." Commercial licensing is available for specific purposes.


