What is US-ITASE 2?
The US-ITASE 2 program is a platform for multiple scientific research projects
that focus on spatial variations across the East Antarctic Ice Sheet between
Taylor Dome and the South Pole. The project is part of the US contribution
to the International Polar Year.
Links:
http://ipy.arcticportal.org/
(IPY Website)
http://www.nsf.gov/od/opp/ipy/ipy_awards_0607.jsp
(List of NSF funded IPY Projects)
The primary goal of the 2 field expeditions is to determine the
spatial variability of the last 200 years across the ice sheet and to compare
this record with the findings of the previous
US-ITASE program in West Antarctica. In cooperation with the rest
of ITASE, US-ITASE aims to contribute to how we understand ocean-ice sheet climate
interactions, climate variabililty, and human impact on climate over the last
200 years. The US-ITASE heavy-traverse platform offers capabilities similar
to a large ocean-going research vessel with logistic and scientific support
for numerous researchers while traveling long distances (1000+ km) with limited
limited intermediate support.
(From the US-ITASE
Executive Summary submitted to NSF):
In its entirety, ITASE incorporates a wide range of general
scientific objectives. Those which are specific to US ITASE address the following
questions:
- What is the current rate of change in mass balance over
West Antarctica?
- What is the influence of major atmospheric circulation systems
(e.g., ENSO) and oceanic circulation on the moisture flux over West Antarctica?
- How does climate (eg., temperature, accumulation rate, atmospheric
circulation) vary over West Antarctica on seasonal, interannual, decadal
and centennial scales, and what are the controls on this variability?
- What is the frequency, magnitude and effect (local to global)
of any extreme climate events recorded in West Antarctica?
- What is the impact of anthropogenic activity (e.g., ozone
depletion, pollutants) on the climate and atmospheric chemistry of West
Antarctica?
- How much has biogeochemical cycling of S, N and C, as recorded
in West Antarctica, varied over the last 200+ years?
US ITASE provides an important spatial perspective for the
shared research goals of a variety of research programs funded by the NSF,
NASA and NOAA. Notably, questions 1-4 parallel closely themes identified by
NSF's WAIS (West Antarctic Ice Sheet) intiative. It is expected that these
overlaps of scientific purposes will make possible an efficient utilization
of logistic resources in the execution of these linked research programs.
Complete US-ITASE
Science & Implementation Plan (from the University of Maine)
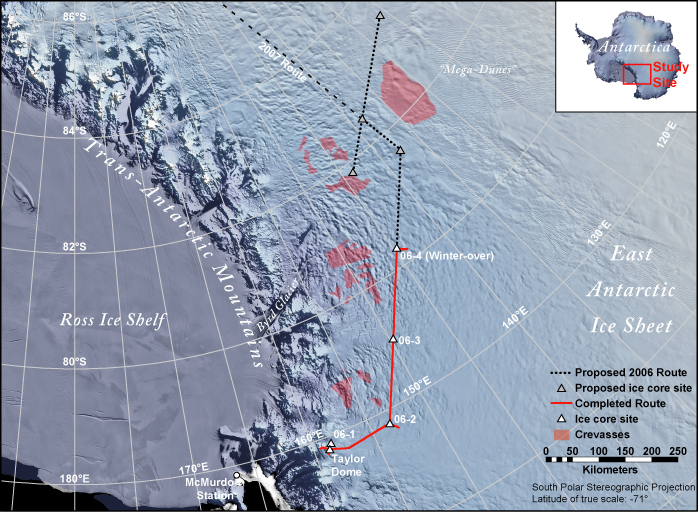
Map of US-ITASE 2 route
US-ITASE 2 Route
Over two years we will traversed from Taylor Dome to South Pole along a corridor
behind the Trans-Antarctic Mountains, passing through the upper reaches of the
major East Antarctic Ice Sheet glaciers that drain into the Ross Ice Shelf.
The actual route was be modified as we encounted crevasses that were not detected
by preliminary satellite image analysis, or discovered features of scientific
interest. We also colleted radar data and ice cores from a number of
short (100-200 km) traverses oriented perpendicular to the main traverse route.
These profiles provided the opportunity to collect data along ice flow lines.

Click on the map for a larger image.
The St. Olaf College contribution to the US-ITASE 2 program
is a deep-penetrating 3 MHz radio echo-sounding system that can measure
the bedrock surface beneath the ice as well as internal layers that have
unique electrical properties. Total ice thickness data is useful
to researchers who develop ice-flow models of the ice sheet. The
immense size of the ice sheet makes it difficult to obtain high-accuracy
thickness measurements over the entire continent. The long distance
traverses of the US-ITASE program make it an ideal platform for ground-based
radar measurements.
Internal ice reflections are usually related to deposition
of volcanic debris (acids or ash) or dust layers. These layers give
researchers a window into the accumulation and flow history of the ice
sheet. Changes in the layer thickness along the traverse routes
may be attributed to changes in snow accumulation due to climate or geographic
changes (crossing a drainage divide, for example). Changes in the
ice flow velocity due to bumps in the bedrock or changes in the bedrock
character cause the ice to thicken or thin as the ice decelerates or accelerates.
We surveyed a number of radar profiles recorded
at Taylor Dome by David Morse and Howard Conway from the Univ. of Washington
prior to the Taylor Dome Ice Core project in the early 1990's. These profiles
will help us establish a baseline for the reflectivity of bedrock frozen
to the ice sheet and also provide dates for internal ice layers. Once
the traverse departed Taylor Dome we recorded radar profiles along the
entire traverse route to establish dating control of the internal stratigraphy
that can be traced back to the Taylor Dome core. We collected radar
profiles on a number of side-traverses that will parallel ice flow in
order to examine the influence of basal conditions on flow dynamics. In
addition we hope to gain access to a number of the ridges separating the
large outlet glaciers that drain the East Antarctic Ice Sheet through
the Transantarctic Mountains to examine the stability of ice flow into
the glaciers. Finally we will visit a number of interesting glaciological
features along the route including Titan Dome, large zones of wind erosion,
and perhaps the edges of the Mega-dunes region. Our 3 MHz radar system
has been upgraded to collect data closer to the ice surface so we hope
to correlate our internal ice stratigraphy with that collected by Steve
Arcone's 400 MHz shallow radar system. Upon reaching the South Pole in
Year 2 of this project we will connect our radar stratigraphy to the data
collected in West Antarctica during the first phase of US-ITASE (1999-2003)
that also finished at South Pole. |
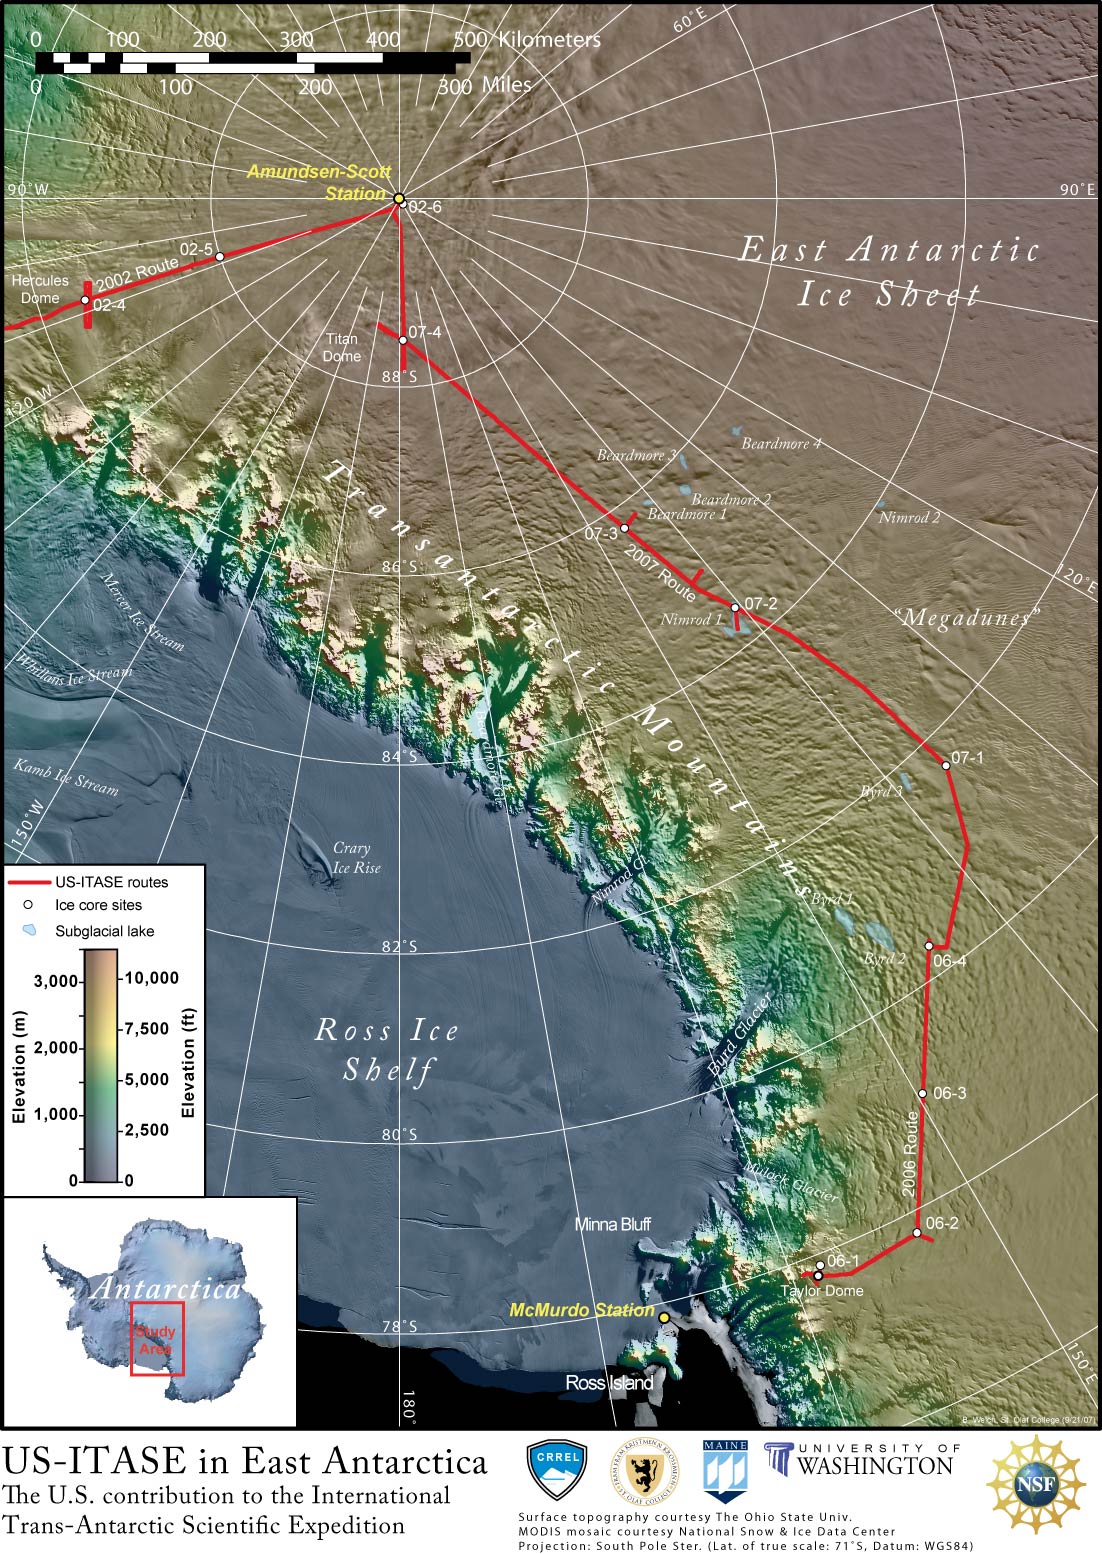
Map of the traverse corridor for US-ITASE
2 starting at Taylor Dome and ending at South Pole. Click the map for
a full-size image. |
Results, Publications & Data
Results of the project will be posted here soon after the first
field season. As we publish our findings we will post relevant data sets at
the
National Snow & Ice Data Center.
US-ITASE 2006:
The traverse route started at Taylor Dome near the Transantarctic
Mts. just west of McMurdo Station. The route headed inland and then turned south
130 km from Taylor Dome. We continued south into the Byrd Glacier drainage,
collecting ice cores at four sites as well as over 500 km of deep (3 MHz) and
shallow (400 MHz) radar data. Logistical problems limited our travel distance
this year, but we still made good progress and expect to make it to South Pole
in 2007.
-Route map
JPG
PDF
-Deep radar profile (3 MHz) from upper Skelton Gl. drainage, 50 km west
of Taylor Dome. Processing includes bandpass filter, NMO, and TK migration.
JPG
-Comparison of 400 MHz crevasse-detecting radar results with shallow reflectors
seen in low-gain channel of 3 MHz data collected in upper Byrd Gl. drainage.
PDF
US-ITASE 2007:
Instrumentation & Methods
We operate a 3 MHz radio echo-sounding system to transmit and
receive radio waves through as much as 3.5 km of ice. This signal frequency
translates to a wavelength of about 56 m in ice. The transmitter (made
by the Kentech) emits pulses at frequency of up to 2 kHz. The pulses
are emitted by our transmitter antenna, a 40 m dipole dragged along the snow
surface. 135 m in front of the transmitter is an identical dipole antenna
that receives the signal. The signal is amplified and passed on to an
oscilloscope board mounted directly on a field-ready PC computer. The
scope board identifies the incoming signal, digitizes it, and sends it to
the computer to be stored on the hard drive. The scope board is extremely
fast, sampling the signal at up to 200 million samples/second. Each
sample of the signal is digitized to a 14-bit value and stored on the computer
along with the recording parameters and a precise time-stamp.
We use the scope board's speed to stack the incoming signal
to remove much of the environmental radio noise that hides our reflected signal.
We stack the data in the field by averaging about a thousand of the transmitter
pulses and their resultant echoes from the bedrock and internal layers.
The traverse train travels at about 12 km/hr so we generally stack 1200-1500
pulses in order to record a trace every few meters. Stacking and the
fast scope board allow us record a dense profile of traces while eliminating
much of the noise that would make the data difficult to process and interpret.
More about basic radio echo-sounding
techniques
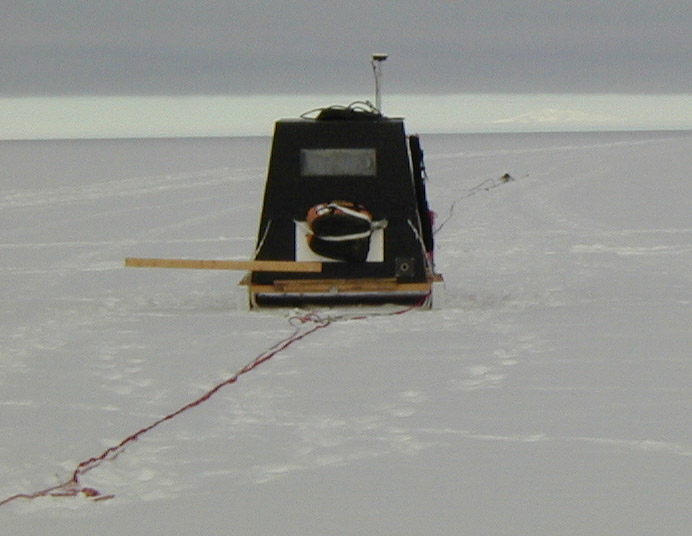
Field Logistics
Our radar system operates primarily during the traverses between
ice coring sites.
The system and operator are towed as the very last sleds in the traverse train
to eliminate radio noise from other instrumentation or reflections from the
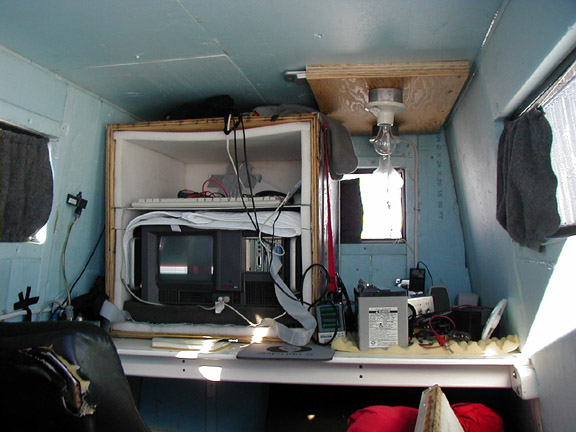
metal sleds and equipment. The receiver and operator are housed in a
small shelter built on a wooden Komatik sled. The shelter protects the
computer and operator from wind, cold, and snow. Power for the receiver
can be derived from a solar-powered battery system, or a small gasoline-powered
generator mounted on the back of the sled. Batteries to power the transmitter
are charged by the solar panels or the generator. The shelter is also
equipped with a GPS receiver to geolocate the radar data. A survival
bag is strapped to the front of the shelter in case of emergency.
The transmitter is towed 135 m or more behind the receiver sled.
The transmitter and its battery sit in a small sled and are protected from
the elements by the sled's nylon cover. The antennas for the transmitter
and receiver are housed in strong hydraulic hoses and tied to the tow ropes
to keep the antennas as straight and parallel as possible.
Picture of the receiver
sled & transmitter sled used in US-ITASE 1
Picture of the
interior of the receiver shelter used in US-ITASE
US-ITASE 2 corridor
Over two years we traversed from Taylor Dome to South Pole along
a corridor behind the Trans-Antarctic Mountains, passing through the upper
reaches of the major East Antarctic Ice Sheet glaciers that drain into
the Ross Ice Shelf. The actual route was modified as we encountered
crevasses that were not detected by preliminary satellite image analysis,
or discovered features of scientific interest. We collected radar
data and ice cores from a number of short (100-200 km) traverses oriented
perpendicular to the main traverse route. These profiles provided
the opportunity to collect data along ice flow lines.
Click on the map for a larger image
|
2006-07 Field season
The traverse route started at Taylor Dome near the Transantarctic Mts.
just west of McMurdo Station. The route headed inland and then turned
south 130 km from Taylor Dome. We continued south into the Byrd Glacier
drainage, collecting ice cores at four sites as well as over 500 km of
deep (3 MHz) and shallow (400 MHz) radar data.
Click on the map for a larger image or open full-resolution

2007-08 Field season
We started the traverse at site 06-4 in the upper Byrd Glacier drainage basin where we left the tractors and sleds at the end of the 2006-07 season. The traverse left the winter-over site on Nov. 15, 2007 and traveled 1,200 km to the South Pole where we arrived on Dec. 24, 2007. Ice cores were collected at four sites, including Titan Dome. We collected nearly 1,400 km of 3 MHz radar data along the route and local profiles at the ice core sites. We found ice over 3 km thick in places, very complicated ice stratigraphy, and evidence of a few subglacial lakes.
Click on the map for a larger image

As an experiment of opportunity designed to image deep ice and take advantage of the traverse platform, the CEGSIC radar produced several notable results. The map figure at the right shows the traverse route passing just downflow of the “Megadunes,” a region of wind-produced structures near Site 07-1, so-named because of their regular dune-like pattern first recognized in satellite imagery. The precise mechanism of their formation and continued maintenance is a subject of considerable interest to glaciologists and has a bearing on the mass balance of the ice sheet.
The figure below shows the CEGSIC radar profile for the 60 kilometer segment just beyond site 07-1. Unlike ice in most of the traverse, the internal layer stratigraphy in this section is highly disturbed. In particular, the section from kilometer 270 to 285 shows a series of dune-like features buried beneath more than a kilometer of ice. How were these structures formed and how are they preserved? Simple burial of megadunes originating upstream can not produce them. Our paper with first author Steve Arcone in the Journal of Glaciology presents a model that explains this interesting occurrence.
|
|
| |
 |
|
The map figure at the right again shows the US-ITASE traverse route, this time with the background colors representing ice sheet velocity determined by mass conservation. The highest velocities (red colors) depict ice funneling through the Transantarctic Mountains in valley glaciers, like the very large Byrd Glacier near the center of the image. Notice that the Byrd glacier has three “jets” of higher velocity feeding the main trunk that extend westward back into the ice sheet.
Colors along the traverse show the power returned by the CEGSIC radar from the basal reflection, warmer colors indicating higher reflectivity. Notice that there is a correspondence between areas with higher reflectivity and the jets with higher velocity. Water at the basal interface is the primary mechanism for producing high radar reflectivity. Water also produces higher ice velocities due to enhanced sliding. The correspondence between areas of thawed bed and higher velocity is expected based on glaciological theory and is shown here based on two independent remotely-sensed data sets.
|
 |
The figure at the right is made from the portion of the radar profile crossing the northern tributary of the Byrd Glacier near 80 degrees south latitude. It shows tracings of the internal layers and colors along the bed indicate basal reflectivity. The color band across the bottom of the figure shows the ice velocity, again illustrating the close correspondence between thawed basal conditions and high velocities.
This correspondence is expected based on glaciological theory, so it is no surprise. But this set of observations from two independent remotely sensed geophysical data sets extends the range of field observations to the interior of East Antarctica and confirms the importance of basal lubrication on modulating the ice dynamics of the largest ice sheet on the planet.
These results have been published in
The Cryosphere.
|
 |
Related Sites
Itase Log at University of Maine
Itase Website at University of Maine
Contact Information
Direct
questions about CEGSIC & St. Olaf low-frequency radar program to:
Dr.
Robert W. Jacobel, CEGSIC Director & US-ITASE Principal Investigator
email: jacobel@stolaf.edu
Office: (507) 786-3124
Fax: (507) 786-3968 |
Direct
questions about this website or US-ITASE radar data to:
Brian
C. Welch, Postdoctoral Researcher (2000-2008)
email:hclewb@gmail.com |
| CEGSIC
Mailing Address:
Center
for Geophysical Studies of Ice & Climate
Department of Physics
St. Olaf College
1520 St. Olaf Avenue
Northfield, MN 55057 |
St. Olaf College undergraduate
researchers:
Ian Campbell - Data acquisition software: 2006-07
Andrea Mulhausen - Data processing & interpretation: 2007
Martina King - Data processing & interpretation: 2007
Bern Youngblood - Data processing & interpretation: 2007 |


